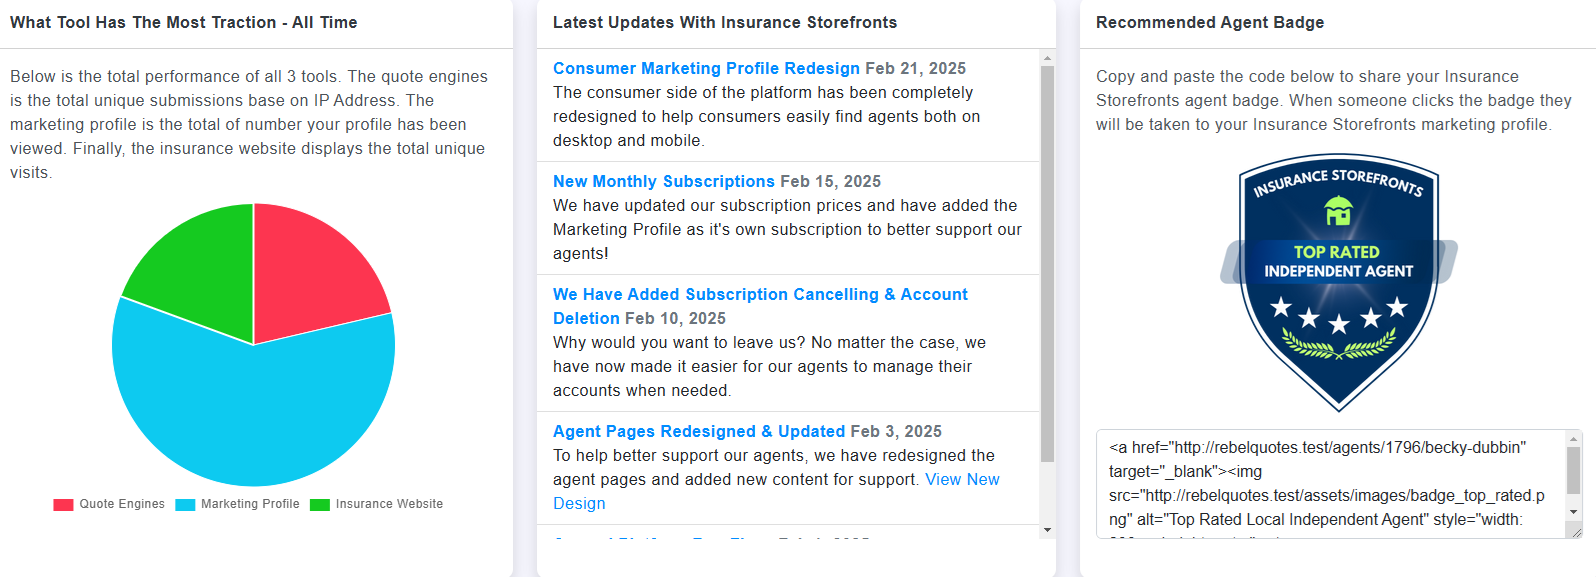
The Analytic Dashboard of Insurance Storefronts provide a pulse on your tools to help you learn how the tools provide are providing results for your business. This can help you understand user behavior, improve decision-making, boost performance, measure marketing ROI and predict future trends.
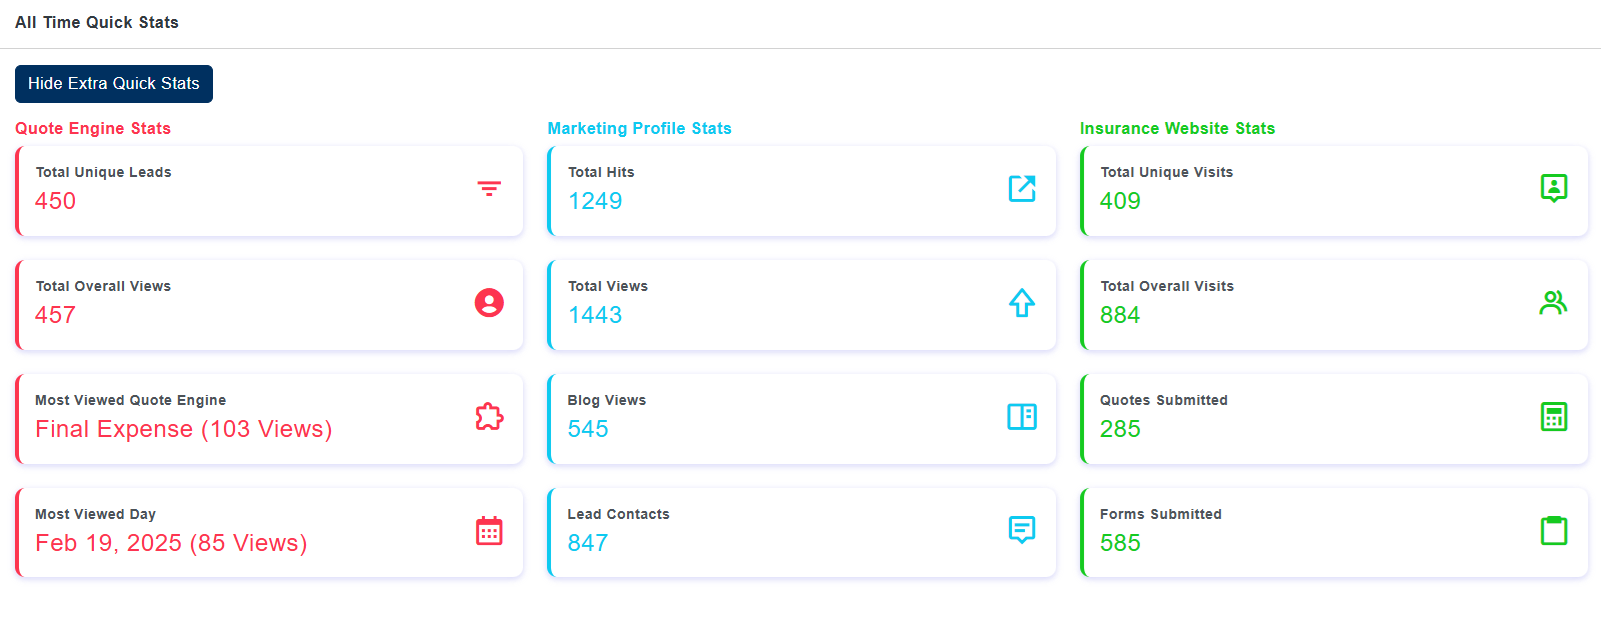
The first analytics you will see on the analytic dashboard is the Quick Stats. When clicking the Display Extra Quick Stats button it will display even more stats on the Quote Engines, Marketing Profile, and your Website Builder.
These stats give you a quick overview on how all of your independent insurance agents tools are performing. This gives you a high-level view how all your tools are performing since you have started using them.
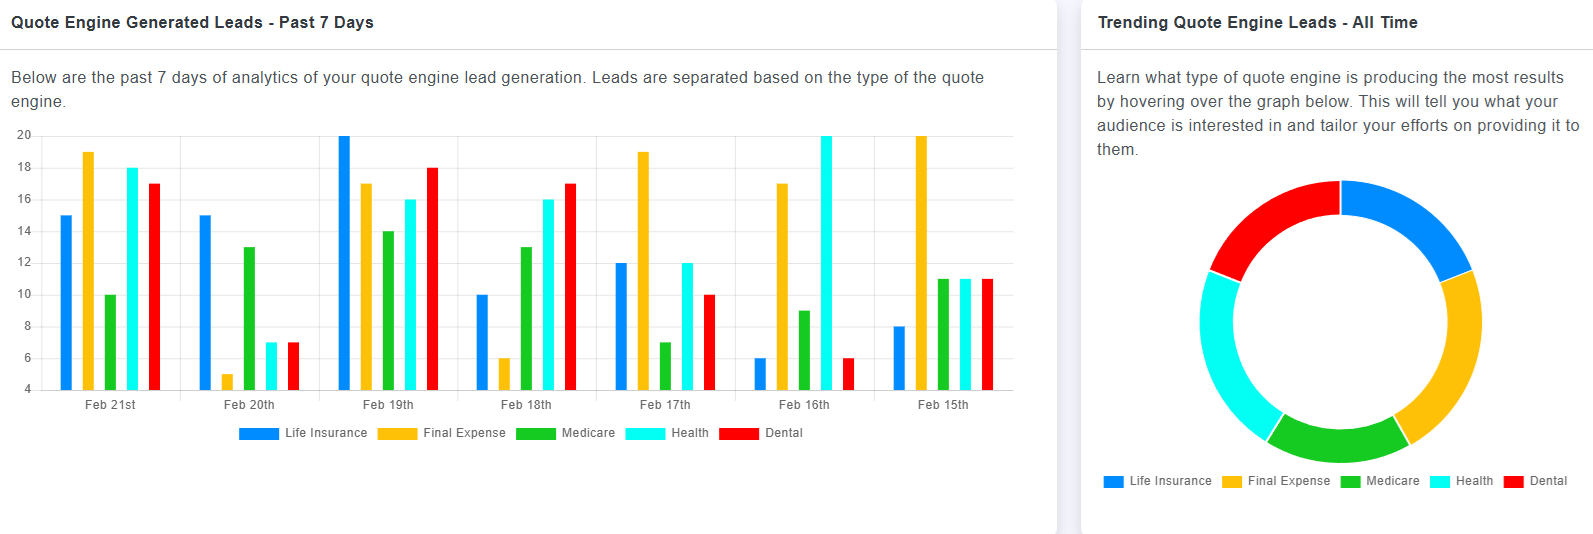
The Quote Engines are a vital part of gaining more traction with prospects. The bar graph will show how all types of your quote engines are performing the past 7 days. The next circle graph will show you the all time generated quote engine prospects divided by quote engine types.
The Marketing Profile is a vital part of a local independent insurance agent tool bag. This tool gets an agent displayed in front of hundreds of consumers that are looking for insurance. So it is important to know how it is performing so that you can adjust and pivot to how the consumer marketing is trending.
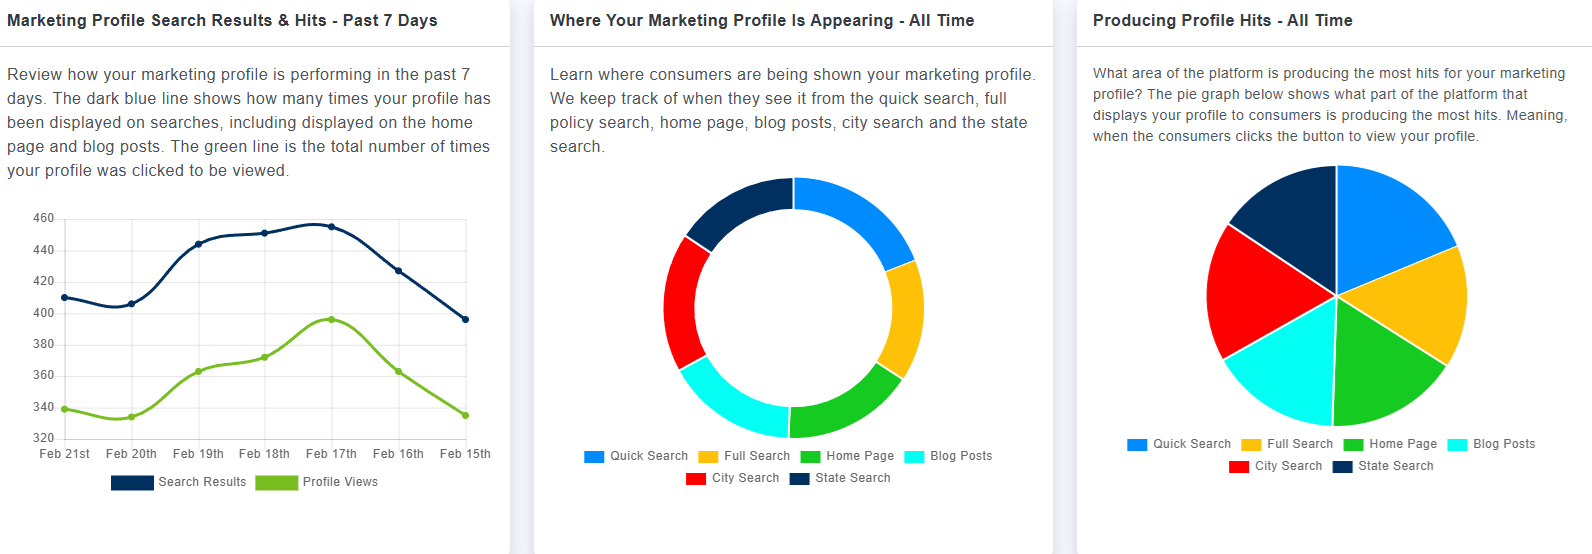
There are three important analytics there to help you learn more how your marketing profile is performing. The first is how many times your profile is showing up in searches and how many consumers are clicking to view your profile. The circle graph displays the locations where your marketing profile is being displayed the most. Finally the pie graph displays what location on our platform that consumers are clicking to view your profile.
Our website builder allows you to bring together all the tools we offer and more so that consumers can access them. So it is important to understand how your website is performing. Although we highly encourage to integrate Google Analytics on the website settings page, we do offer several stats for the website builder.
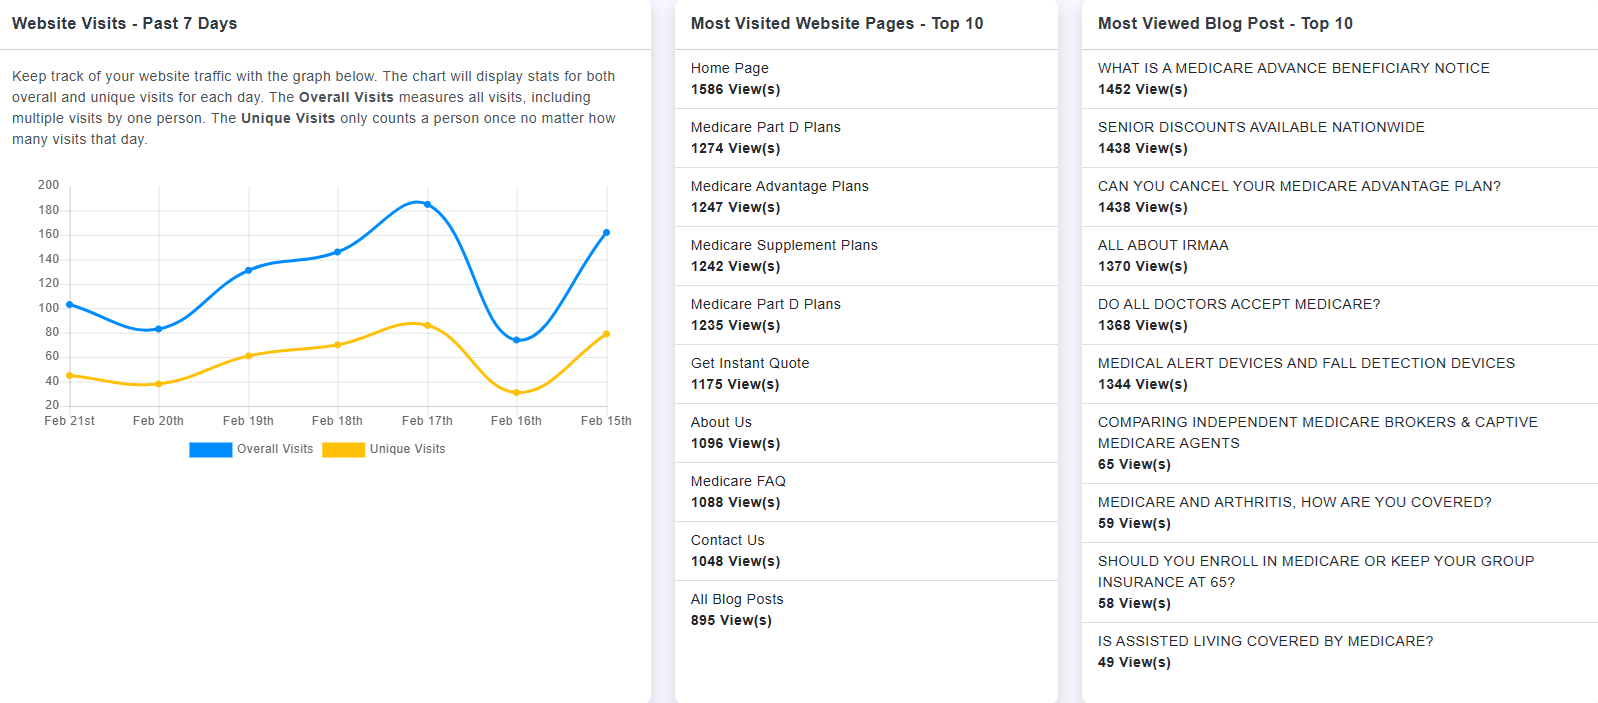
The first graph will show you traffic for the past seven days. This includes the total overall visits and unique visits based on IP Address. The next section is a table displaying your top 10 most visited pages along with the total view count for that page. Finally we display your top 10 most viewed blog posts as well as the total view count for the post.
Our Analytics Dashboard is designed to help our agents get a pulse on their tools that we provide. Besides what was listed above, you can share your Top Rated Badge, get the latest news on what we are working on, and more data to help you easily get to what you're looking for.
Sign up with the Platinum Agent plan and save over 66% for all of our local independent insurance agent tools. This includes our Top Rated Agent Marketing Profile, Prospect Generating Unlimited Quote Engines, Easy-To-Use Website Builder and A.I. Capabilities that no other agent directory offers. Of course, enjoy watching your business grow with our Analytics Dashboard.